
Beyond Swing and Miss: Understanding Contact in a Whole New Light

Picture this: a 95 mph fastball rockets toward the plate, and in a heartbeat, the hitter has to choose—take or let it rip by? Now imagine facing that hundreds of times a season and connecting hopefully more often than not. Hitting a baseball might just be the most difficult skill in sports—yet some guys make it look like a walk in the park. So how do we spot the real contact kings?
For most hitters, this struggle never ends. If you can’t put the ball in play consistently, you’d better bring something else to the table—think jaw-dropping power, a knack for walks, or gold-glove defense. Without that, surviving the big leagues is nearly impossible.
Why Swing-and-Miss Stats Are Lying to Us
How do we currently assess a player’s contact ability? Traditional metrics like Swing-and-Miss Rate, Whiff Rate, and even overall Strikeout Rate attempt to quantify a hitter’s ability to make contact. While these numbers provide a surface-level understanding, they often fall short of offering true context.
Swing-and-Miss Rates, for example, fail to account for whether the pitch should have been contacted. Was it a hittable pitch in the middle of the zone that the batter simply missed? Or was it a near-unhittable breaking ball sweeping away from the zone? Was the pitch located in an area where contact is realistically expected, or was it a perfectly executed pitcher’s pitch? A simple yes-or-no binary for contact doesn’t tell us nearly enough.
That brings us to the purpose of this post: developing a better way to evaluate hitters by incorporating context into our assessment of contact ability.
The Contact Spectrum: A Better Way to Assess Hitters
Imagine Contact Above Average (CAA) as a hitting report card with a twist—it’s not just pass or fail, it’s about earning extra credit for the tough stuff. This isn’t a binary stat that says, “Yep, he hit it.” Instead, CAA grades every swing based on the sheer quality of the pitch. A 92 mph fastball thrown right down? That’s a gimme—an easy A. Whiff on that, and you’re getting a big red mark, because 9 out of 10 big leaguers would have made contact with that particular pitch in that location. But a slider that dives off the plate like it’s dodging a bounty hunter? If you manage to put that pitch in play—especially one that’s tough to handle—you’re adding serious value. This isn’t just about making contact; it’s about understanding the details behind it. We’re considering pitch velocity that pushes the limits, spin rates that challenge hitters, pinpoint locations, and even the deceptive arm angles that turn every at-bat into a chess match.
Here’s how it works. CAA starts by sizing up every pitch’s difficulty to put in play—think of it like a video game boss. Using Statcast data, we can analyze thousands of pitches to predict how likely the average hitter is to make contact. A flat 92 mph heater belt-high? The model says it’s in play 90% of the time. An elite sweeper that breaks two feet and kisses the black? Maybe 30% of hitters survive that gauntlet. From there, we give out credits and debits like a tough-but-fair teacher. Swing and miss at that fastball down the pipe? You’re docked hard—should’ve been a no-brainer. But if you manage to get wood on that disappearing slider, you’re golden—the model understands that only the slickest hitters pull that off.
We can track every swing, from Opening Day to the final out, across tens of thousands of pitches. The payoff? A single, sharp metric that rises above the clutter—a true reflection of a hitter’s ability to square up the baseball. It’s not just about making contact; it’s about making the right kind of contact. That’s the Contact Above Average advantage—a smarter, deeper way to recognize the best in the box.
How Does This Play Out Across the Strike Zone?
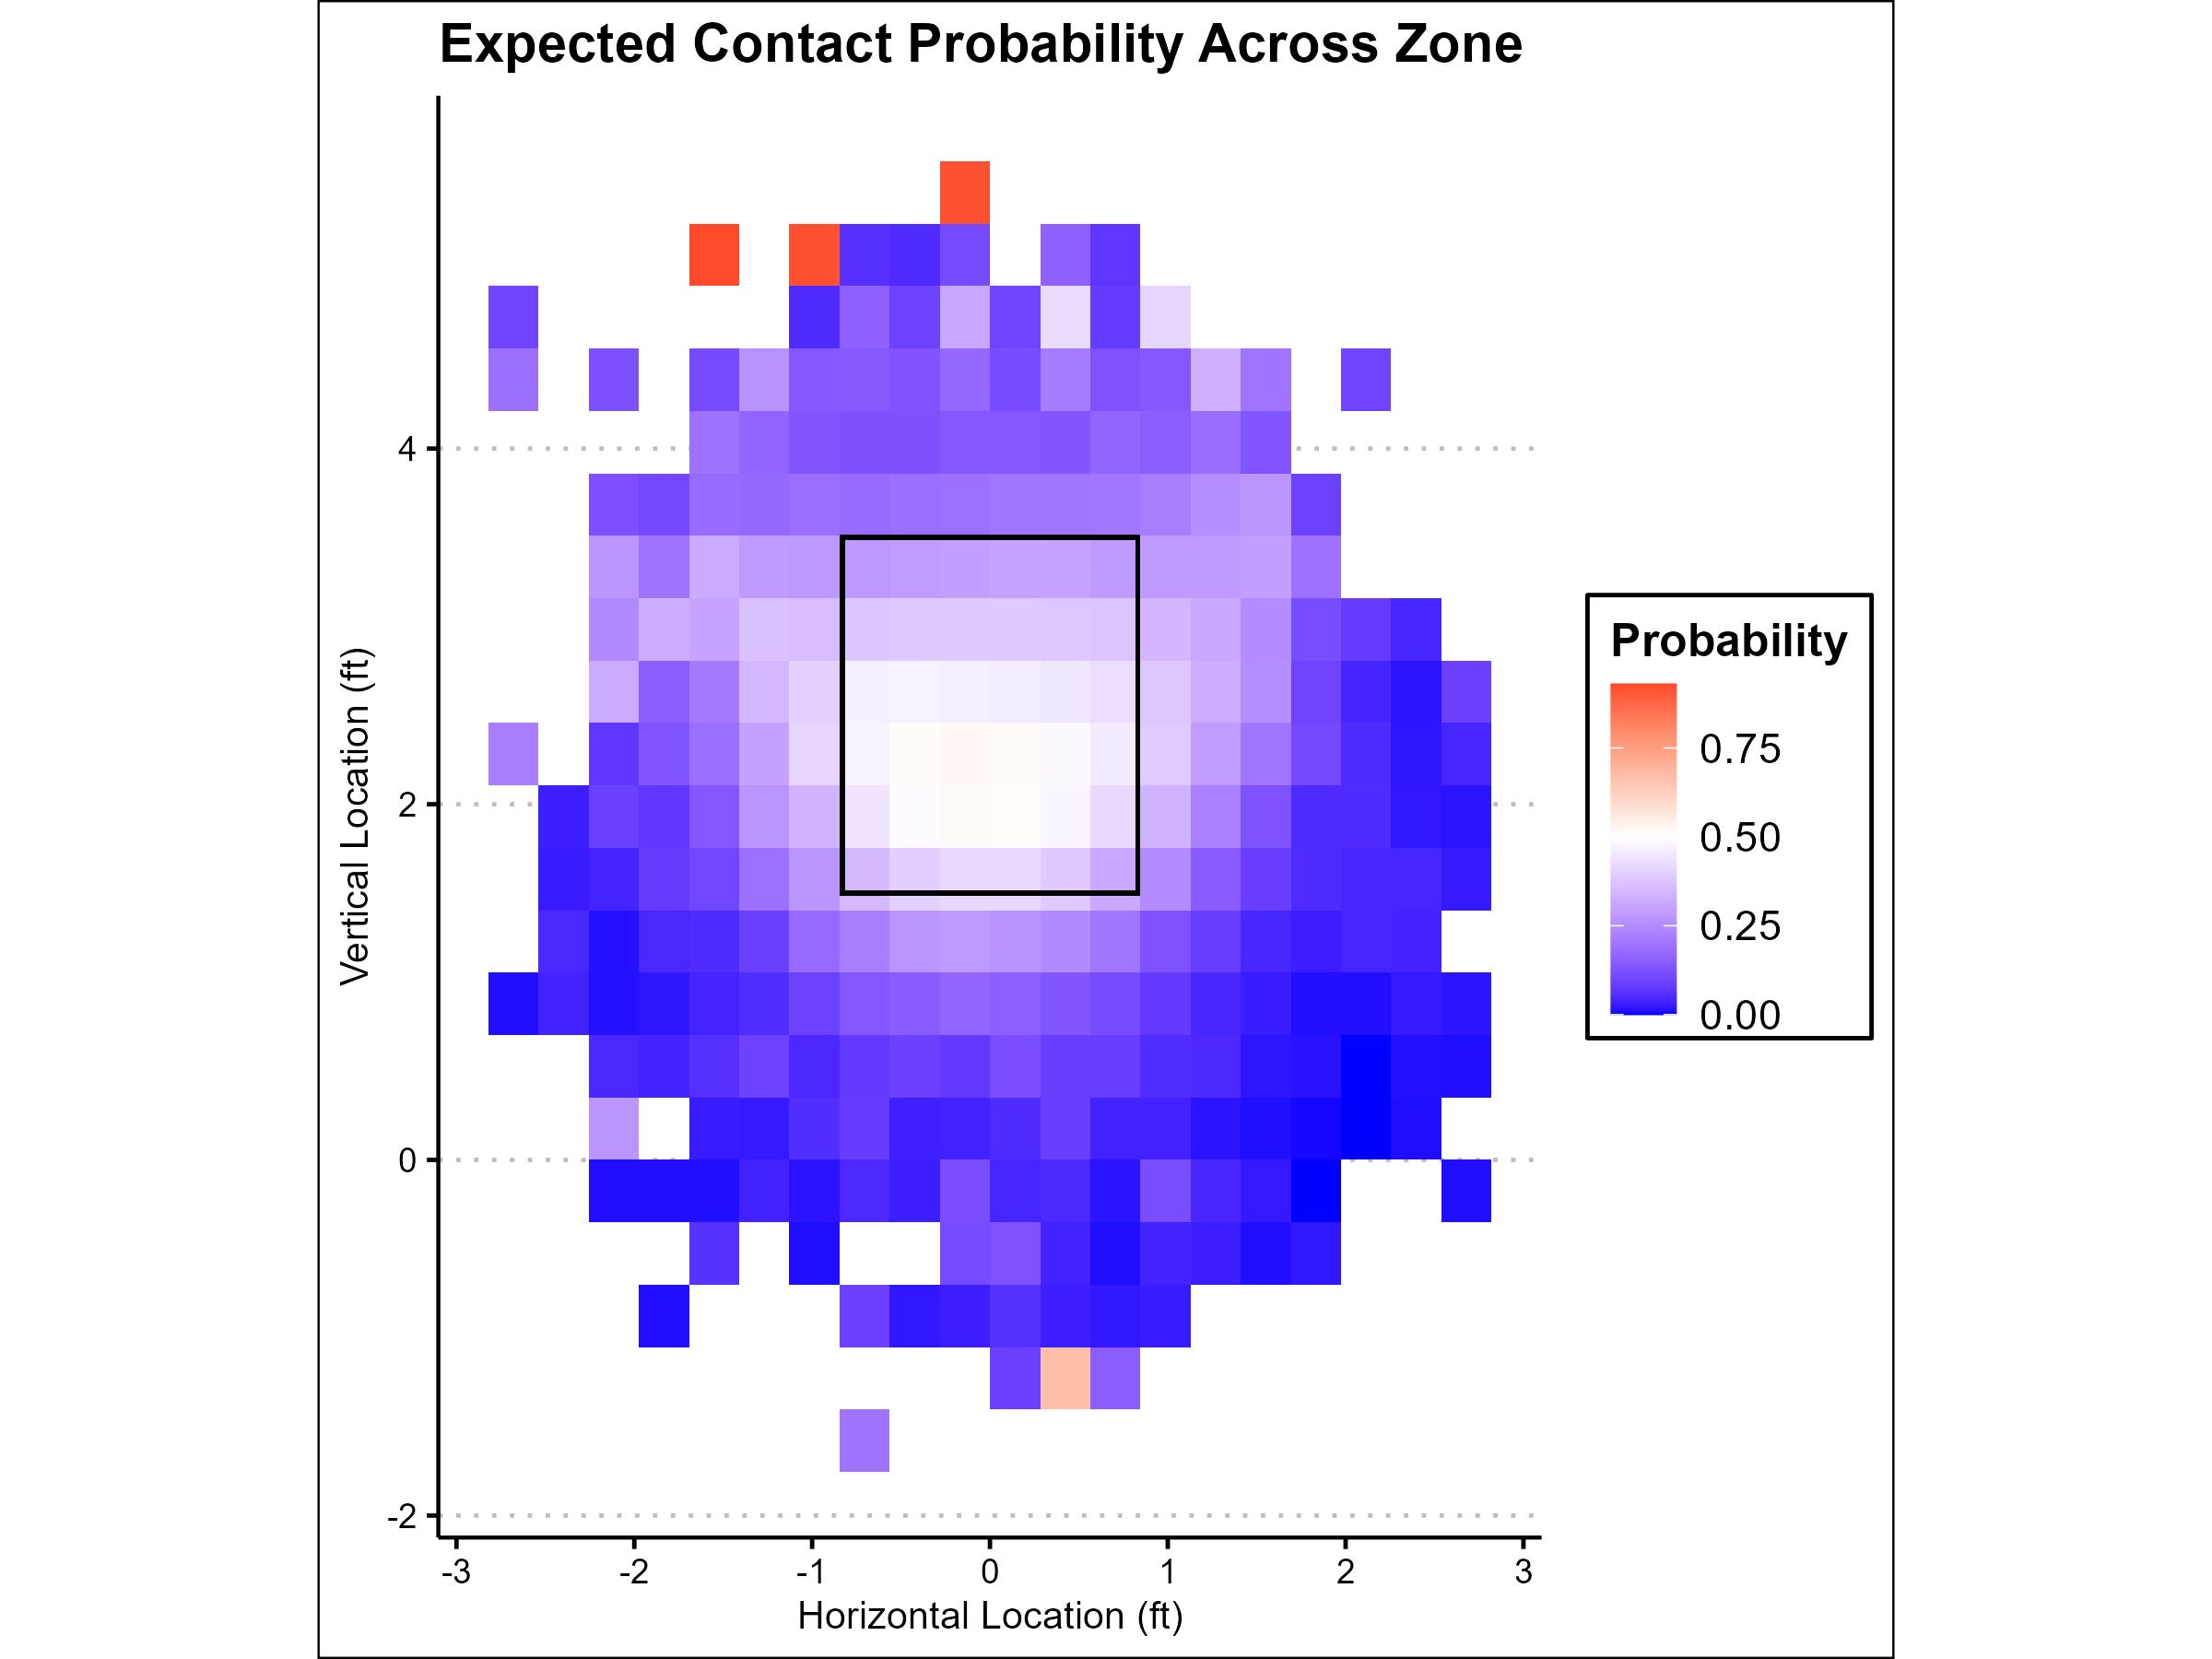
League-wide, CAA paints a clear picture of where hitters succeed and where they struggle. The data shows that most hitters thrive in a handful of zones but falter when challenged on the edges or against elite pitch movement. High fastballs remain a problem area for many, while breaking balls down and away continue to generate weak contact and whiffs.
On the flip side, there’s a clear area in the strike zone where hitters consistently excel—this is often referred to as the “sweet spot” or the “meatball” zone. It’s a tight, small area in the middle of the zone, where pitches are easier to square up and hit with authority. This is where most hitters can make solid contact, drive the ball, and increase their chances of success. These pitches are typically easier to handle, and hitters are more likely to make consistent, effective contact, this zone is the bread and butter of almost all hitters, and CAA makes it clear just how valuable those pitches are when they’re in a hitter’s wheelhouse.
Who’s Winning (and Losing) at the Plate?
This approach doesn’t just answer questions—it blows the lid off stuff we’ve been too hidden from to figure out. Are we overhyping hitters who get lucky with hittable pitches? Are we sleeping on guys who fight tooth and nail against the nasty stuff? Finally, we’ve got some answers.
With Contact Above Average, we’re no longer just measuring whether a hitter makes contact—we’re measuring his ability to make contact in relation to the pitch itself. This shift in perspective allows us to better evaluate players, refine scouting reports, and ultimately develop a clearer understanding of what it truly means to be a good contact hitter.
Breaking Down the Results
As we begin analyzing the results from the Contact Above Average model, some clear trends emerge. First, very few players display the ability to make consistent contact across all areas of the strike zone. The traditional nine-square strike zone model illustrates that even elite contact hitters tend to have strengths and weaknesses within specific zones.

For example here is Steven Kwan is a great example of a hitter who maintains high contact ability across almost the entire strike zone, with only a few small areas where he struggles. Same goes for Luis Arraez who stands out even more, showing near-universal contact proficiency across all areas of the plate, reinforcing his reputation as one of the most well-rounded hitters in baseball.

Most hitters have a handful of zones—typically four or five—where they thrive, consistently squaring up pitches and driving the ball with authority. Outside of those comfort zones, though, their effectiveness drops, leading to weaker contact, more whiffs, or poorly timed swings.

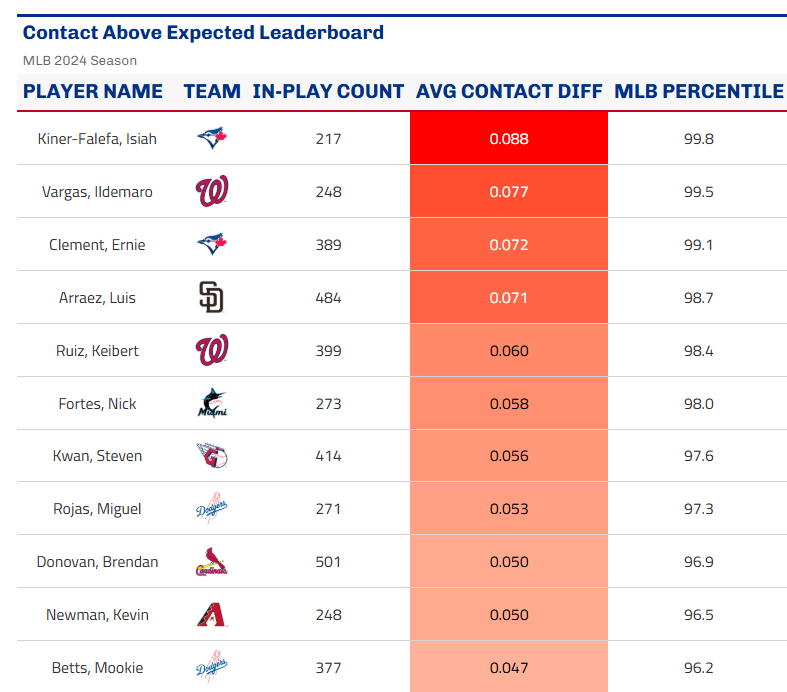
When we apply this model across the league, we see some expected names at the top. Hitters like Luis Arraez, Steven Kwan, and Keibert Ruiz rank among the best in contact ability. These players are already known for their elite bat-to-ball skills, and the model confirms their ability to put the ball in play even against more challenging pitches.
But not all contact hitters follow the same pattern. Some excel in certain zones but struggle elsewhere. This brings us to the next level of analysis—identifying contact weaknesses and tendencies.
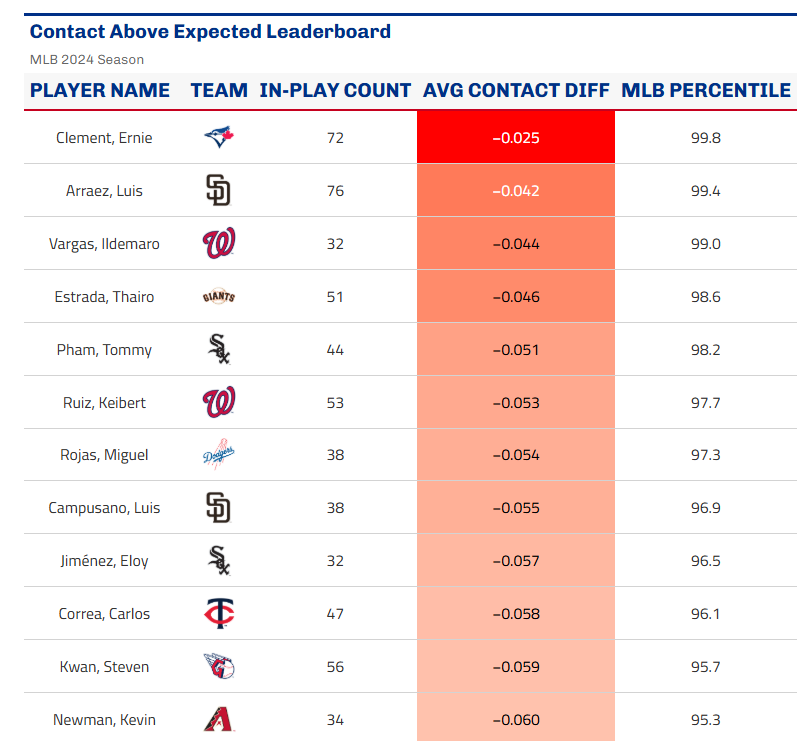
What becomes even more interesting is when you factor in pitch quality and analyze how hitters perform against the toughest pitches—the ones with elite velocity, sharp movement, and precise location. These are the so-called "unhittable" pitches, the ones that leave most batters frozen or swinging through air. (Every hitter has a negative score for these types of pitches. Below is when hitters face pitches that are suppose to get contact less than 50% of the time. Good look at who still puts the ball in play:
Final Thoughts
Contact Above Average (CAA) isn’t just another stat to toss around—it’s a game-changer. Forget treating every swing the same; this model sizes up each pitch’s nastiness and cuts through the fog, spotlighting who’s truly elite at slapping leather on the ball.
Ditching basic swing-and-miss rates lets us:
Unmask flaws the old numbers miss.
Find hidden gems who tame the tough stuff.
Sharpen training by zeroing in on weak spots.
Supercharge scouting with razor-sharp insights.
CAA doesn’t just nod at the contact kings we already know—it rewires how we break down and build hitters.
Dig deeper with team leaderboards, and rolling graphics here:
Contact Above Average Leaderboards
The data’s screaming it: we’ve been half-blind about hitters. CAA flips the table, sorting the real deals from the lucky ducks. Next time you see a slider fouled off or a meatball whiffed, don’t just shrug—ask what’s really up. Hit the leaderboards. This is where hitting analysis gets real.
Stay ahead of the curve. Subscribe now for more insights, exclusive leaderboards, and the latest in hitting analysis straight to your inbox.